
Finding which lakehouse architecture performs best on your infrastructure is expensive. Deploying a single stack on Kubernetes by hand takes days (ask me how I know). A different catalog, a different query engine, a different version, different resource profiles. The cost of the first deployment is high. The cost of repeating it for every permutation is prohibitive.
Lakebench is a lakehouse benchmark that deploys the infrastructure it tests. Most lakehouse benchmarks focus on table format comparisons (Iceberg vs Delta vs Hudi) or query engine throughput against a stack that already exists. Lakebench deploys the full stack on Kubernetes, generates data, runs a pipeline through bronze (raw), silver (transformed), and gold (queryable) stages, scores the result, tears it down, and does it again with a different configuration. It doesn’t simplify deployment. It simplifies testing.
The Gap in Existing Tools
LHBench runs TPC-DS against table formats on AWS EMR. NetEase’s lakehouse-benchmark measures mixed OLTP/OLAP. These are useful, but they don’t deploy the stack, don’t generate pipeline data, and don’t score the full path from ingestion to queryable output.
Lakebench scores the entire pipeline. Query engines are one component. The pipeline has catalog overhead, Apache Iceberg table format behaviour, orchestration, and storage I/O underneath. Benchmarking the engine misses all of that. The difference between “Trino is slow” and “Trino scored fine at this scale, so the problem is our query patterns.”
Get Running
pip install lakebench-k8s
If you have a Kubernetes cluster and an S3-compatible object store, you have everything you need. The config is six lines:
name: my-lakehouse
recipe: hive-iceberg-spark-trino
platform:
  storage:
    s3:
      endpoint: http://your-s3:80
      access_key: YOUR_KEY
      secret_key: YOUR_SECRET
The recipe line sets the full stack. Everything else defaults. Change that one line and you get a completely different architecture to compare against.
lakebench init --interactive              # Or generate config interactively
lakebench validate lakebench.yaml         # Check config + connectivity
lakebench deploy lakebench.yaml           # Deploy the full stack
lakebench generate lakebench.yaml --wait  # Generate test data
lakebench run lakebench.yaml              # Run pipeline + scorecard
lakebench report                          # View results
lakebench destroy lakebench.yaml          # Tear everything down
Prerequisites: Any Kubernetes-based platform (upstream K8s, OpenShift, Rancher, EKS, GKE, AKS) with kubectl and helm. An S3-compatible object store. A StorageClass for Spark shuffle PVCs.
(PyPI package is lakebench-k8s because lakebench was already taken. CLI command is still lakebench.)
The Scorecard
After lakebench run completes, you get a scorecard.
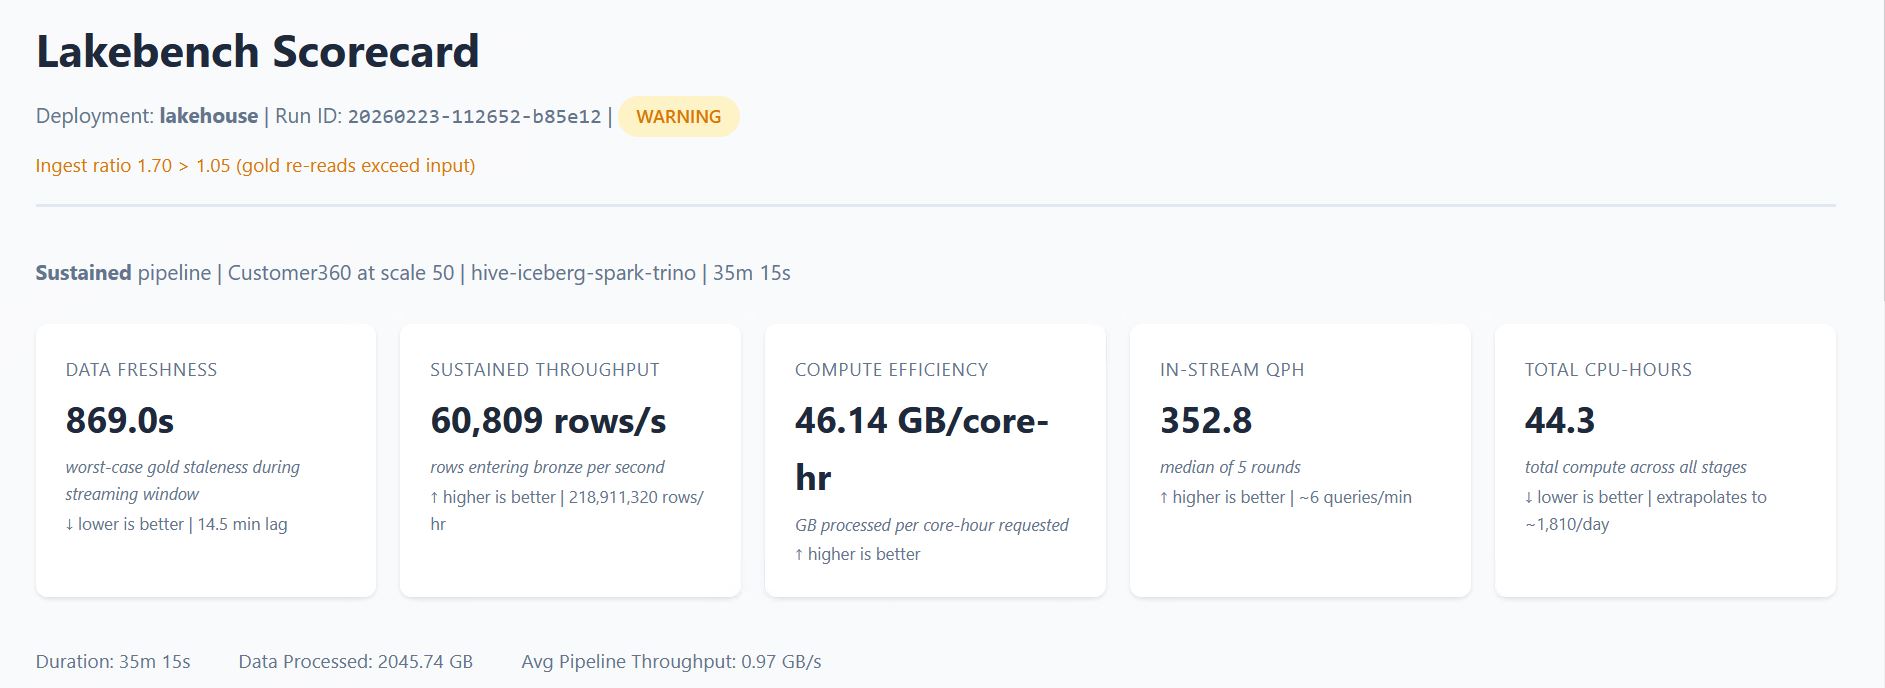
The scorecard measures time-to-value from raw data to queryable gold (or data freshness in sustained mode), compute efficiency in GB per core-hour, and per-stage breakdowns showing where time and compute are actually spent.

The scorecard breaks the pipeline into stages and shows which one consumed the most resources. If silver is eating 69% of your CPU, you see it. If adding executors doesn’t improve throughput, you see that too.

lakebench report generates the full HTML scorecard. lakebench report --summary prints a compact version to the terminal. Structured JSON output is also available for programmatic comparison between runs. When observability is enabled, the report includes platform metrics: CPU, memory, and S3 I/O per pod.
The dataset is Customer360: customer interactions across purchases, browsing, support tickets, and logins. Synthetic, schema-conformant, and generated at whatever scale you specify. The data generator is a container image you can replace if you want a different workload shape.
Three Experiments
“Which stack should I use?” Deploy hive-iceberg-spark-trino, run the scorecard, tear it down, then deploy polaris-iceberg-spark-duckdb and compare. Same data, same queries, different architecture. The swap is a one-line config change.
“How does this scale on my hardware?” Pick a stack and increase the scale factor. The scale controls how much data is generated into the bronze layer:
| Scale | Bronze Data | Approx Rows |
|---|---|---|
| 1 | ~10 GB | 1.5M |
| 10 | ~100 GB | 15M |
| 100 | ~1 TB | 150M |
| 1000 | ~10 TB | 1.5B |
Run at scale 10, then scale 100, and the scorecard shows exactly where throughput plateaus or resources saturate. lakebench recommend can auto-detect your cluster capacity and find the maximum feasible scale factor.
“Can my stack sustain repeated load?” Sustained mode generates data in intervals, processes each batch through the full pipeline, and benchmarks query performance between cycles. The scorecard measures data freshness, throughput over time, and whether the pipeline falls behind the ingest rate.
architecture:
  pipeline:
    mode: sustained
    sustained:
      run_duration: 1800
      benchmark_interval: 300
Recipes and Advanced Configuration
Recipes give you eight validated stacks across two catalogs (Hive Metastore, Polaris REST) and three query engines (Trino, Spark Thrift, DuckDB). The table format is Apache Iceberg and the pipeline engine is Spark today. The recipe naming convention has slots for both so the system is ready when additional formats and engines are added.
| Recipe | Catalog | Format | Pipeline Engine | Query Engine |
|---|---|---|---|---|
hive-iceberg-spark-trino |
Hive Metastore | Iceberg | Spark | Trino |
hive-iceberg-spark-thrift |
Hive | Iceberg | Spark | Spark Thrift |
hive-iceberg-spark-duckdb |
Hive | Iceberg | Spark | DuckDB |
hive-iceberg-spark-none |
Hive | Iceberg | Spark | — |
polaris-iceberg-spark-trino |
Polaris REST | Iceberg | Spark | Trino |
polaris-iceberg-spark-thrift |
Polaris REST | Iceberg | Spark | Spark Thrift |
polaris-iceberg-spark-duckdb |
Polaris REST | Iceberg | Spark | DuckDB |
polaris-iceberg-spark-none |
Polaris REST | Iceberg | Spark | — |
But the recipe is just the starting point. The full YAML exposes everything underneath: component versions (pin Trino 479 or test against 480), Spark executor sizing (cores, memory, overhead, PVC sizes), executor counts, pipeline mode, query engine worker counts, and observability settings. Take a recipe scorecard as your baseline. Change the Trino worker count from 2 to 4, re-run, and the scorecard delta is attributable to that one change. Upgrade Spark, re-run. Double executor memory, re-run. Each experiment isolates one variable against a known baseline.
Synthetic Workload, Real Infrastructure
Lakebench tears down between runs and starts from clean state every time. It is not trying to simulate your production environment. The workload is synthetic and the conditions are controlled.
That’s deliberate. Lakebench isolates infrastructure variables from workload variables. Catalog latency, S3 throughput, Spark shuffle behaviour, Iceberg metadata operations, query engine overhead: these are properties of the stack, not the data. A synthetic pipeline at 500 GB exercises the same storage I/O paths, the same catalog operations, and the same executor coordination patterns as a production pipeline at 500 GB. The column types and transformation logic differ, but the infrastructure pressure points are the same.
You test the infrastructure with a controlled workload so that when something is slow in production, you already know whether the problem is the stack or the code. That’s a question you can’t answer if you never benchmarked the stack in isolation.
Audience
Platform engineers evaluating lakehouse architectures on their own infrastructure. The first run has real prerequisites (K8s cluster, S3, StorageClass, Spark Operator), but once that foundation is in place, every subsequent comparison is a config change and a re-run.
Anyone running POCs or storage comparisons. Lakebench runs the same pipeline against different infrastructure configurations and produces comparable scorecards. Point it at one S3 endpoint, run, then point it at another, re-run. The scorecard is the deliverable.
It’s also a learning tool. Deploy a full stack, inspect every Kubernetes resource, run the pipeline, change one thing, see what happens. You learn more from breaking a running system than from reading about one.
Get Started
pip install lakebench-k8s
lakebench init --interactive
GitHub: PureStorage-OpenConnect/lakebench-k8s
PyPI: lakebench-k8s
Docs: lakebench-k8s/docs
Open-source from Pure Storage. Apache 2.0.