
Part 2 of The Economics of Data Architectures in 2026
Part 1 surveyed seven architecture patterns, each with its own economics. Warehouse bets on centralization. Lakehouse bets on eliminating the ETL tax. Mesh bets on distributed ownership. And so on.
But here’s the question nobody asks at selection time: what will it cost to leave?
The evidence says they should. McKinsey surveyed 450 CIOs and found only 15% migrated on time and on budget. KPMG puts the overrun rate at 79%. The consistent culprit isn’t adoption complexity. It’s transition complexity: the training, the data interdependencies, the operating model changes that only surface when you’re already committed.
Exit planning, when it happens at all, happens too late.
Failure Rates
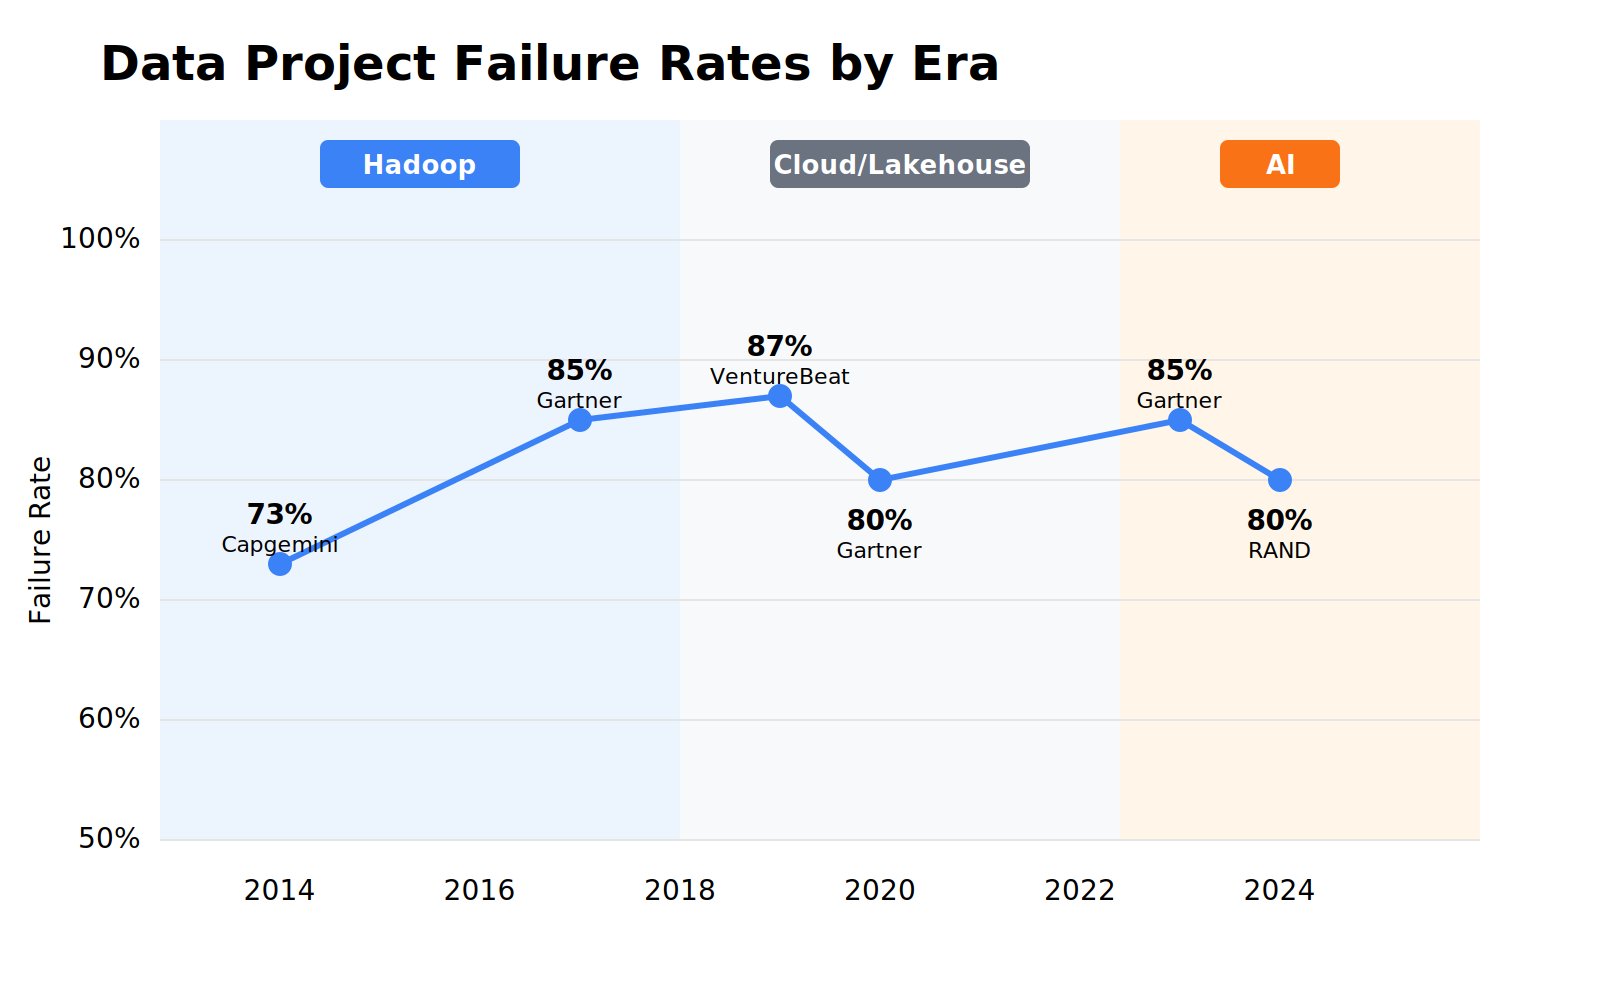
Hadoop to Spark to cloud to lakehouse to mesh to AI. The average lifespan of a dominant paradigm is 3-5 years. Every organization that adopted Hadoop in 2012 faced a switching decision by 2017. Every organization that went all-in on cloud warehouses in 2019 is navigating lakehouse and AI pressure now.
You’ve seen the failure statistics before. Capgemini found 27% success in 2014. Gartner’s Nick Heudecker later admitted their 60% failure estimate was “too conservative,” the real number was closer to 85%. Lakehouse era: still above 50%. Then AI arrived: RAND found over 80% of AI projects fail, twice the rate of non-AI IT. The technology changed completely. The failure rate didn’t.
The failure modes stayed consistent too: siloed architecture, poor data quality, no metadata, systems built for one use case. If technology was the constraint, new technology would have fixed it.
That suggests the binding constraint is something else: the cost of data architecture isn’t what you pay to run it. It’s what you pay to change it.
The Switching Tax
Every transition carries a tax: migration, retraining, replatforming, rebuilding pipelines. Implementation and integration costs routinely run 1-3x the software cost for ERP systems; complex CRM implementations like Salesforce can run 3-5x the license fee. Data platform migrations are no different. Organizations front-load investment into one pattern, then discover three years later the world has moved on.
The switching bill includes:
– Migration labor. Engineers rebuilding ETL, rewriting transformations, remapping schemas. Routinely underestimated.
– Retraining. Teams learning new tools, new query patterns, new ops models. Productivity drops for months.
– Parallel running. Two systems running simultaneously during cutover. Double the infrastructure cost, often for longer than planned.
– Business disruption. Reports break. Dashboards go stale. Stakeholder trust erodes.
– Opportunity cost. Every engineer migrating is an engineer not building new capabilities.
IBM calls this the “migration tax,” and it compounds over time. When pipelines are hardcoded to one vendor’s APIs or formats, every architectural shift triggers a costly rewrite.
When it’s time to change, organizations face a choice: pay a fortune to migrate, or limp along on something that no longer fits. Most limp. Then they pay anyway when the next wave forces the issue.
The Duplication Tax
Most enterprises don’t run one architecture. They run several: a warehouse for BI, a lake for data science, a streaming layer for real-time, maybe a mesh in some domains, now AI and vector stores bolted on.
You know what this looks like. Your warehouse says Q3 revenue was $42M. Your lake says $41.3M. Someone spends three days reconciling the difference. Turns out a currency conversion was applied in one pipeline but not the other. By the time it’s resolved, the board deck has already gone out with the wrong number.
That’s one field, in one quarter, in one company.
Data gets copied into each system, transformed slightly differently, and drifts over time. Nobody knows which version is authoritative. Storage costs multiply. ETL jobs sprawl across platforms. Access controls, compliance, and retention policies have to be replicated per copy. The longer those copies exist independently, the further they diverge: field definitions shift, schemas evolve, “revenue” starts meaning something different in the warehouse than the lake.
Duplication is a one-time mistake. Drift is what makes it compound. And it’s not an episodic cost. It’s a daily tax.
Cost Structures
These are different cost structures:
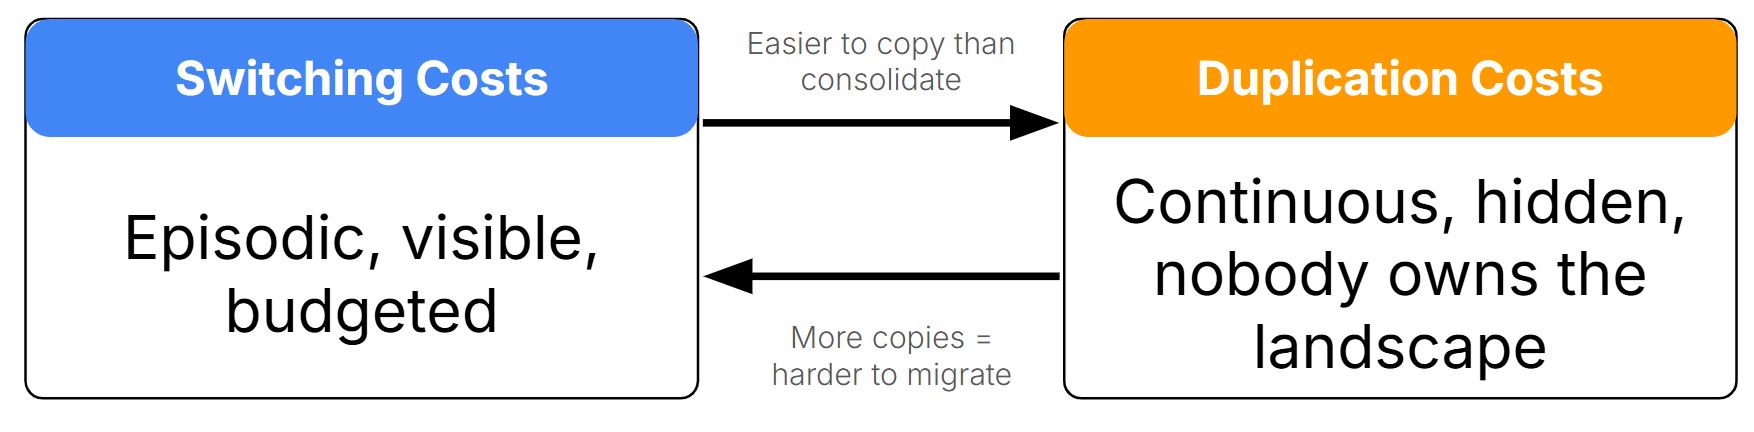
Switching costs are episodic but large. You see them on the balance sheet. They get budgeted (usually under-budgeted). Leadership knows they’re happening.
Duplication costs are continuous but hidden. Spread across teams, nobody owns the total. They don’t show up as a line item.
But they feed each other. High duplication makes switching harder: more copies means more to migrate. High switching costs encourage duplication: it’s easier to copy data into yet another system than to consolidate. Most enterprises sit in the intersection, paying both simultaneously.
The persistent failure modes across eras (siloed architecture, poor data quality, no metadata) aren’t technology failures. They’re data management failures: governance, quality, documentation. That’s what keeps data frozen. And frozen data is why both costs keep compounding.
Data Liquidity
If the binding constraint isn’t the architecture but the ability to move data between architectures, then the thing worth optimizing isn’t which pattern you pick. It’s a property of the data itself.
Data liquidity is the degree to which your data can survive an architectural transition without requiring reconstruction. Liquid data migrates. Frozen data forces a rebuild.
Liquid data reduces switching cost because it’s portable: accurate, documented, modular, accessible via APIs. It flows into whatever architecture comes next. Liquid data reduces duplication cost because it can be accessed across architectures without copying: one authoritative source, multiple consumption patterns. Frozen data has to be rebuilt for every transition. Siloed, undocumented, embedded in application logic. You don’t just change platforms. You start over.
MIT CISR formalizes this as six characteristics (accurate, available, combinable, relevant, secure, readily usable) and three management levers: modular architecture, rigorous data preparation, and flexible permissioning. Notice that two of three levers are management, not architecture. Liquidity depends on how your architecture and management practices overlap. You can pick the right architecture and still have frozen data if nobody documents it, curates it, or makes it accessible.
Measuring Liquidity at Selection Time
Exit costs are hard to model precisely, but you can estimate them directionally. Three questions function as a liquidity test before you commit:
| Question | High Exit Cost (Frozen) | Lower Exit Cost (Liquid) |
| Where does transformation logic live? | Embedded in the platform | In portable code (dbt, Spark jobs, etc.) |
| What format is data stored in? | Proprietary | Open formats (Parquet, Iceberg, Delta Lake) |
| Can metadata travel with the data? | No, locked in platform catalog | Yes, via open catalog standards |
These aren’t precise calculations. But they’re actionable. Monday morning, someone can ask these questions in a vendor meeting.
The shift toward open table formats like Apache Iceberg reflects this logic. Iceberg is vendor-neutral and broadly supported across cloud providers and query engines. 77% of businesses have adopted data lake or lakehouse architectures. The ones choosing open formats are hedging against exit cost whether they frame it that way or not.
Data Liquidity Case Studies
Fidelity Investments is an example of what this looks like at scale. After consolidating over 100 data warehouses into a common analytics platform with universal IDs, single customer profiles, and a central taxonomy, they reported a 60-80% reduction in the effort required to provision data for new analytics use cases. That’s switching cost reduction, measured.
Starting in 2017, Caterpillar built Helios, a cloud-native unified data platform that consolidated fragmented applications and data silos into a single backbone. Three design choices made the difference:
- Modular architecture organized for reuse rather than single applications
- Product-oriented data management with machine learning validation services to enhance data accuracy
- API-first access that decoupled data from specific consumption patterns
When GenAI arrived in 2024, they deployed a service recommendation engine on existing foundations. No rebuild, no new data silos. Their Helios platform now manages over 16 petabytes of data from 1.5 million connected assets.
The investment in liquidity paid off as both reduced switching cost (AI deployment without replatforming) and reduced duplication (one authoritative source serving eCommerce, fleet management, and predictive maintenance simultaneously).
The MIT CISR case study on Caterpillar identifies three “data liquidity levers” that any organization can manage: data architecture, data preparation, and data permissioning. Caterpillar pulled all three.
Conclusion
Two pressures are converging, and liquidity addresses both.
- The pace of architectural change is accelerating. Hadoop lasted five years as the dominant paradigm. Cloud warehouses maybe four. Lakehouse is already being complicated by AI. If you face a major transition every 3-5 years, and each one carries substantial implementation costs on frozen data, liquidity becomes a hedge against inevitable change.
- Most enterprises also run multiple architectures simultaneously. Data gets duplicated across all of them. Each copy drifts. Liquid data can be accessed across architectures without duplication. One authoritative source, multiple consumption patterns.
Most organizations ask: “What’s the right architecture?” That assumes you pick once. History says you’ll switch every 3-5 years. The better question: can my data survive the next transition?
If yes, architecture becomes a choice you can revisit. If not, every transition is a rebuild. The architecture owns the organization.